Skip to content
We have all been there. It is the morning of a big presentation. You have your slide deck open on one screen and a spreadsheet open on the other. You are frantically copying and pasting the latest figures, double-checking every decimal point, and praying you don’t make a typo.
It is tedious, stressful, and frankly, a waste of your valuable time.
But what if your text boxes could update themselves? What if the “Total Revenue” on slide 3 automatically changed the moment your spreadsheet was saved? With the INSYNCR plugin, this isn’t just a dream—it is your new reality.
In this guide, we will walk you through the simple process of turning static PowerPoint text boxes into dynamic, data-driven elements.
Note: This guide assumes you have already installed INSYNCR and established a connection to your data source (Excel, SQL, JSON, etc.). If you haven’t done that yet, please hop over to our guide on Setting Up Your Data Connections and come back when you are ready to link!
Why Link Text Boxes?
Text boxes are the most fundamental element of any presentation. They hold your headlines, your KPIs, your dates, and your narrative. When you make them dynamic, you unlock a level of automation that transforms your workflow.
- Accuracy: Eliminate copy-paste errors. The number on the screen is exactly what is in your database.
- Speed: Refresh a 50-slide deck in seconds rather than hours.
- Consistency: Ensure that the same metric displayed on five different slides is identical across the board.
The Basic Linking Process
Getting data into a text box is surprisingly straightforward. The INSYNCR interface is designed to feel native to PowerPoint, so you don’t need to be a programmer to make it work.
Step 1: Select Your Text Box
Start by opening your PowerPoint presentation. Insert a new text box or select an existing one that you want to animate with data.
- Pro Tip: You don’t need to type anything into the text box. Once linked, INSYNCR will overwrite any existing text with the data value.
Step 2: Open the Text Box Properties
Navigate to the INSYNCR tab in your PowerPoint ribbon. In the Shapes group, you will see a button labeled Text Box. Click it.
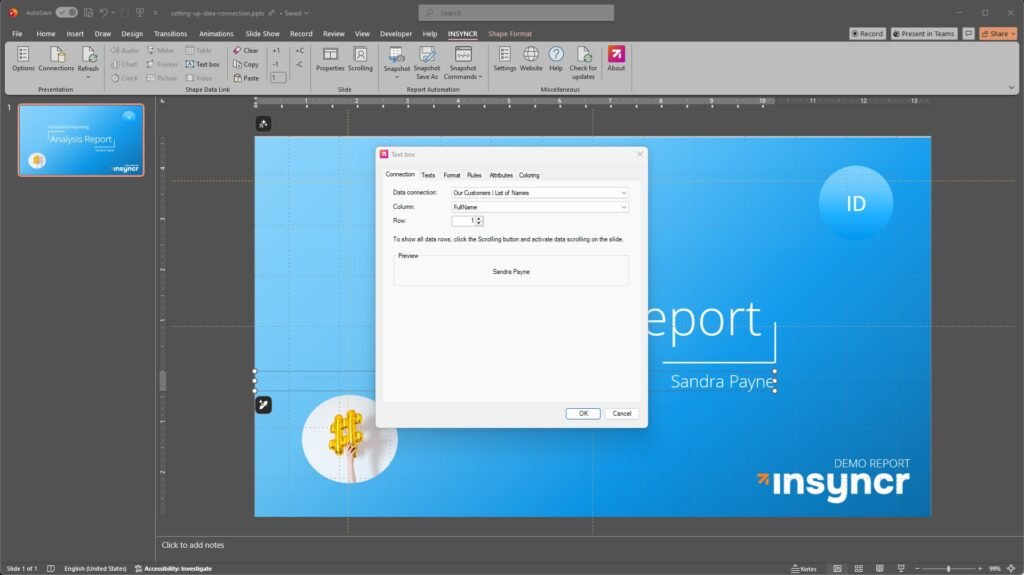
This opens the INSYNCR Text Box Properties window. This is your command center for this specific shape.
Step 3: Choose Your Data Point
Inside the properties window, you will see a few dropdown menus that allow you to pinpoint the exact data you need:
- Data Connection: Select the data source you set up earlier (e.g., “Monthly Sales Excel”).
- Column: Choose the specific field you want to display (e.g., “Revenue,” “Product_Name,” or “Q3_Growth”).
- Row: Specify which row of data you want to grab. For a single KPI, this is usually Row 1. If you are building a list across multiple text boxes, you might select Row 2, Row 3, etc.
Once you click OK, you will see the value from your data source appear instantly in your text box on the slide.
Refining Your Data: The Format Tab
Raw data often looks… well, raw. A database might store a number as 12500.555, but on your executive summary slide, you want it to look like $12,500.56.
Instead of changing the data in your source, you can format it directly in INSYNCR.
- Select your linked text box and click the Text Box button again.
- Navigate to the Format tab.
- Choose your Category:
- Number: Set specific decimal places and use 1000 separators.
- Currency: Automatically add currency symbols ($€£) and format as financial figures.
- Date/Time: Convert a timestamp like
2023-10-25T14:30:00into a friendly format likeOct 25, 2023. - Percentage: Instantly turn
0.15into15%.
This ensures your presentation always looks professional, regardless of how the raw data is formatted in the backend.

Adding Context: The Texts Tab
Sometimes, just showing a number isn’t enough. You need context. You want your slide to say “Current Temperature: 72°F,” not just “72.”
While you could create two separate text boxes (one for the label, one for the data), INSYNCR allows you to combine them smartly using the Texts tab in the properties window.
- Prefix: Enter text here to appear before the data value. (e.g., type “Sales: ” to display “Sales: $500”).
- Suffix: Enter text here to appear after the data value. (e.g., type ” units” to display “500 units”).
- Empty Value Replacement: What happens if your database returns a blank cell? Instead of showing an empty hole in your slide, you can tell INSYNCR to display a fallback text like “N/A” or “Pending.”
- Non-Existing Row: If you linked a text box to Row 10, but your data source only has 5 rows this month, you can set a custom message like “No data available” to prevent errors.
Advanced Features for Smart Slides
INSYNCR offers several advanced behaviors that solve common presentation headaches. These are also found within the text box properties.
1. Dynamic Font Sizing
Have you ever linked a text box to a name field, only to have a long name like “Alexander‑Benjamin” cut off or overlap with other graphics because the box was sized for “John”?
In the properties, you can enable Dynamic Font Size. You set a minimum and maximum font size (e.g., 12pt to 24pt). INSYNCR will automatically shrink the text size if the data is long, ensuring it always fits perfectly within the bounds of your text box.
2. Conditional Rules
Data is most useful when it tells a story. You can set up Rules to change the appearance of your text box based on the data value.
For example, you can create a rule that says:
- If [Value] is Less Than 0, set font color to Red.
- If [Value] is Greater Than 0, set font color to Green.
Now, your financial slides don’t just show numbers; they visually alert the audience to performance status automatically.
Real-World Use Cases
How does this look in practice? Here are a few ways users are leveraging dynamic text boxes:
The Project Dashboard
A project manager links text boxes to a SharePoint list. The slide header automatically updates to “Project Status: [Phase]”, and the body text updates with the latest project description. They never have to manually update the weekly status deck again.
The Financial Report
A CFO links text boxes to an Excel sheet export from their accounting software. Every month, they open the presentation, hit “Update,” and every revenue, expense, and profit figure updates across 20 slides, complete with currency formatting.
Conclusion
Linking data to text boxes is the “low-hanging fruit” of presentation automation. It requires minimal setup but offers a massive return on investment in terms of time saved and errors avoided.
By using the INSYNCR plugin, you move away from the static, dead text of the past and embrace a workflow where your presentation is always living, always accurate, and always ready to present.
Ready to try it? Open INSYNCR, select a text box, and make your first link today.