 Skip to content
The manual way, and what it costs
Most client packs are built the same way: the analyst exports from the performance system to Excel, tidies the tables, copies each chart and figure into last quarter's deck, and reads it three times looking for the one that did not get updated. For a pack of 30 slides and 20 clients that is a working week per quarter, and the week is spent on the least valuable part of the job.
The cost is not the week. It is the number on slide 4 that still shows last quarter, because it was the one chart nobody touched, and the client noticed.
Why Excel links break in PowerPoint
The next step most teams try is Paste Link: paste the Excel chart into PowerPoint with a live link. It works on the analyst's own machine for a while, then breaks the way it always breaks:
- The workbook moves, gets renamed, or lives on a colleague's drive, and the link points at nothing.
- Two people edit the deck and the links resolve to two different files.
- The chart updates but the number in the text box next to it does not, because text boxes cannot be paste linked.
- Formatting drifts: the linked chart brings Excel's colors and fonts back into the brand template every refresh.
- Nothing filters. One workbook per client, one deck per client, and the count of things to maintain doubles.
If you cannot tell, for any number on any slide, which cell or query it came from, the deck is not linked. It is copied.
The bound template way
A bound template is one PowerPoint deck where every figure, chart and table is tied to the place its data comes from, and a filter decides which client you are looking at. INSYNCR is a PowerPoint add in that does this inside the deck you already have.
1. Connect to where the data already is
Excel or Excel Online for most teams (Starter). SharePoint, Google Sheets, Access and MySQL in Business. SQL Server, PostgreSQL, Oracle, Salesforce, ODBC and OData in Professional, which is how the performance and portfolio systems are usually reached. The add in uses the credentials you already have; nothing is uploaded.
2. Bind each shape to its data
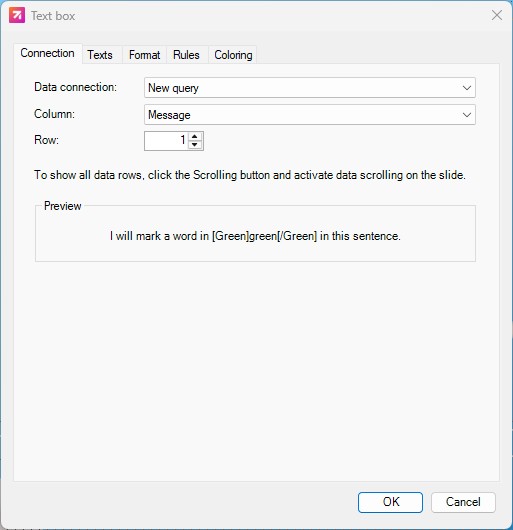
Click a text box, a chart or a table on the slide and choose the cell, column or query it should show. Text boxes bind like charts do, so the number in the sentence and the number in the chart come from the same place.
3. Filter per client
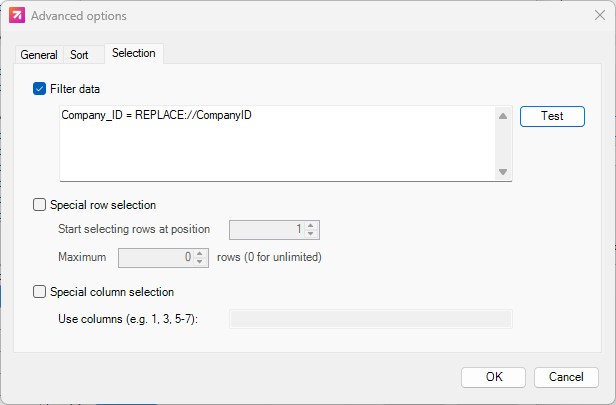
One template, one filter. Set the client or fund as the filter value and every bound shape follows. Snapshot then produces one file per client, PowerPoint or PDF, named as you name them.
4. Rules for the things that change shape
Conditional formatting colors a value by rule, so a negative return is red without anyone checking. Smart slide logic includes or excludes a slide by rule, so a client with no alternatives allocation does not get an empty alternatives page.
5. Refresh at quarter end
New period, new data, one click. The reviewer reads what changed rather than everything again, and the auditor can follow any number back to its source.
What review looks like afterwards
The four eyes check does not go away. It gets shorter, because the question changes from "is every number right?" to "did the rules do what we meant?". Teams that moved to bound templates report more reports per analyst and clients moving to monthly rather than quarterly, because monthly is now a Refresh.
Lumen Research replaced manual copy and paste and broken Excel links with linked templates. Clients moved to monthly and quarterly reports, and reporting became a recurring revenue stream. "It saves me so much time, by taking the administrative and repetitive away, so I can focus on quality."