 Skip to content
The client pack you rebuild every quarter, refreshed in one click.
A client pack, a fund factsheet or a performance report is the same slides every cycle with new figures in them. Most teams fill those figures in by hand: find the number in the portfolio system, copy it, paste it into the slide, check it, and do that a few hundred times before the deadline. INSYNCR links every number, chart and table in Microsoft PowerPoint to the place its data actually lives. Next quarter you open the same deck, press Refresh, and read it instead of building it.
Also called: automated client reporting, data reporting in PowerPoint, PowerPoint reporting automation, factsheet automation.
No credit card · Your data stays on your PC · Windows, Office 2016+
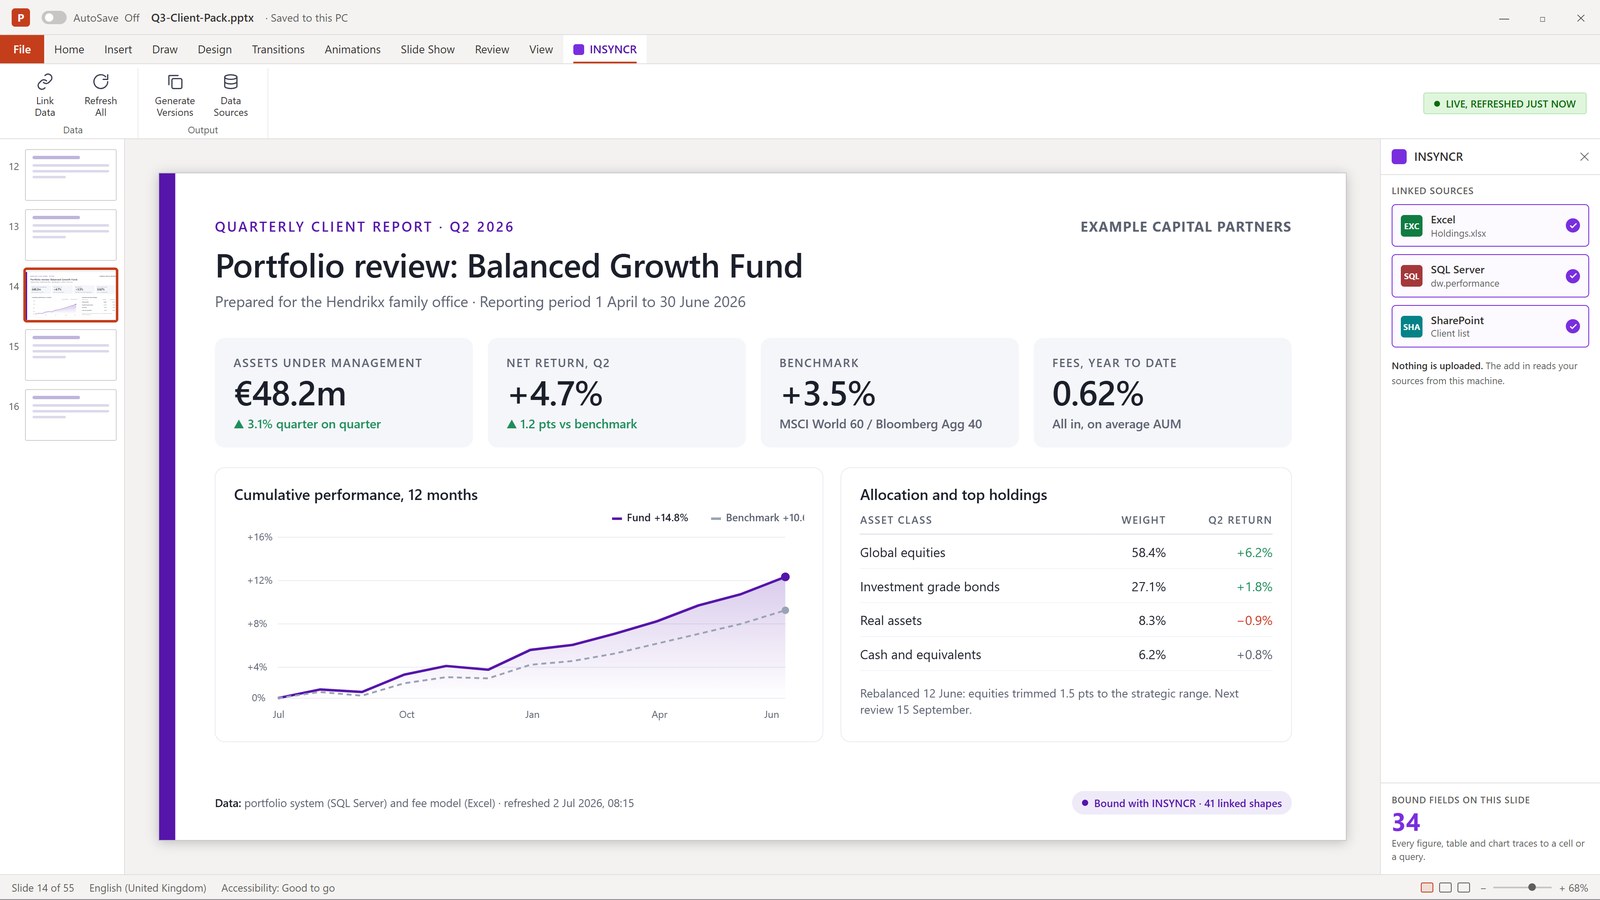




Link once. Refresh forever.
Link the pack once
Open your existing client pack. Bind each figure, chart and table to its cell, query or view: Excel, SharePoint, SQL Server, your performance system through ODBC or OData.
Filter per client
One template, one filter per client or fund. Snapshot produces one file per client, PowerPoint or PDF, named as you name them.
Refresh at quarter end
New period, new data, one click. The reviewer checks the numbers that changed, not the whole deck.
What it looked like before, and after.

“It saves me so much time, by taking the administrative and repetitive away, so I can focus on quality.”Lumen Research: manual copy and paste and broken Excel links replaced by linked templates. Clients moved to monthly and quarterly reports, and reporting became a recurring revenue stream.
Your sources, your template, your reviewers
- Your performance system, your Excel models, your SQL views
- Your PowerPoint template, your brand, your disclaimers
- Your four eyes review before anything goes to a client
The rebuild
- No copy and paste from Excel into PowerPoint
- No hunting for the chart that did not update
- One template for every client instead of one deck per client
- Reviewers see what changed, not everything again
AI can draft your deck. It cannot promise that slide 4 matches the ledger.
A generated number is a guess that reads well. A bound number is a cell, a query or a field you can point at, inspect and explain to someone who cannot read code. When the report has a consequence, that difference is the product.
Fluent, and unaccountable
Ask an assistant for the quarterly pack and you get a plausible deck. Nobody can tell a correct rule from a convincing wrong one, and a report generated for the wrong client is a perfectly correct report. Nothing downstream detects it.
Every number has an address
Each figure, chart and table in the slide is linked to the exact cell, view or field it came from. Refresh brings the new data through the same link. The reviewer checks what changed, and the auditor can follow the line back.
Use Copilot to write the commentary. Use INSYNCR to make sure the numbers under it are real.
Nothing leaves the building.
Runs on the user's PC, with the user's own access
A tab in PowerPoint. Sources open with the permissions the user already has; INSYNCR adds none and stores none. There is no INSYNCR cloud and no copy of your data anywhere else.
An installer, an interface, support, and a person
What a script on someone's laptop does not have, the night before the board meeting.
Questions people ask before they try it
Can INSYNCR produce one client pack per client from a single template?
Yes. One PowerPoint template, one filter per client or fund, and Snapshot produces one file per client in PowerPoint or PDF, named as you name them. Snapshot Save As is in the Business plan and above.
Which data sources does client reporting usually need?
Excel and Excel Online are in Starter. Business adds SharePoint, Access, Google Sheets, JSON, XML and MySQL. Professional adds SQL Server, PostgreSQL, Oracle, Salesforce, Dynamics, ODBC and OData, which is how most performance and portfolio systems are reached.
Does our data go to INSYNCR's servers?
No. INSYNCR runs inside PowerPoint on the analyst's own machine and reads sources with the credentials the analyst already has. Nothing is uploaded and no copy is stored anywhere else.
How is this different from Power BI or think-cell?
Power BI is where the analysis lives; the client reads a PowerPoint. INSYNCR binds that PowerPoint to the same data. think-cell draws charts; INSYNCR keeps the numbers in them current. Most teams use both.
How do we buy it for a team?
Per user, annual or monthly. The analysts who build the pack take Starter, Business or Professional; everyone who reads or refreshes it takes a Viewer seat at 27 euros a month, billed annually. Card on the site, invoice from 10 licenses, purchase orders through the For IT page.
Start with the pack you rebuilt last quarter.
No credit card · Your data stays on your PC · Windows, Office 2016+
The teams that buy it for this.
Asset and wealth managers
Client packs, fund factsheets, performance and attribution, every quarter, signed off by someone whose name is on it.
Consultancies and agencies
A deliverable that goes to the client, built on the model or the campaign data, every month.
Anyone who reports to a board
The pack is the same shape every cycle and the numbers have to reconcile with the system they came from.
Four signs it is
- The same deck is rebuilt from the same systems every cycle
- Somebody checks the numbers against the source by hand before it goes
- A figure has been wrong in it at least once
- The person who builds it is more expensive than the task
13 sources, on Business
 Excel
Excel- Excel Online
 Google Sheets
- Text and CSV files
- XML files
- JSON files
- The file system, as a data source
 SharePoint lists and libraries
 Microsoft Access
- Exchange
 Outlook
 Google Calendar
 MySQL
MySQL
Business, €191.66 a month, billed annually per user
Client reporting is where a wrong number costs something, which is why the binding matters more than the speed. Every figure on the slide points at the cell, the row or the query it came from, so the check is the refresh.
Not sure this is your problem yet? The three versions of it, and what each one cost