 Skip to content



What's inside the insurance portfolio review template?
Thirteen 16:9 slides. Every chart and table is a native PowerPoint object you can edit, and every slide has speaker notes that explain what goes there and where the numbers usually come from.
| # | Slide | What it shows |
|---|---|---|
| 1 | Cover | Company, lines of business and quarter |
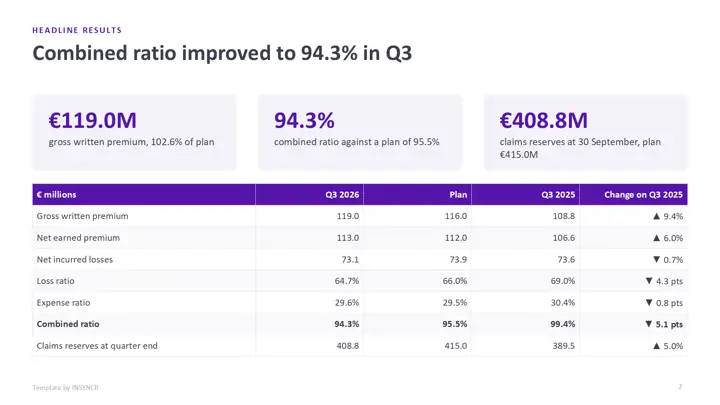
| 2 | Headline results | Written and earned premium, incurred losses, loss, expense and combined ratio, reserves, against plan and last year |
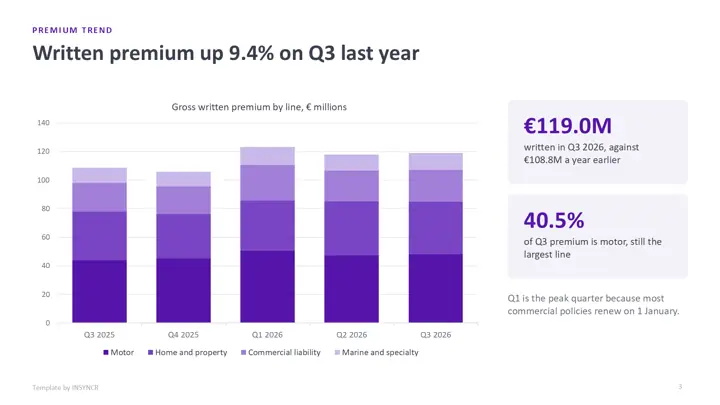
| 3 | Premium trend | Gross written premium by line over five quarters |
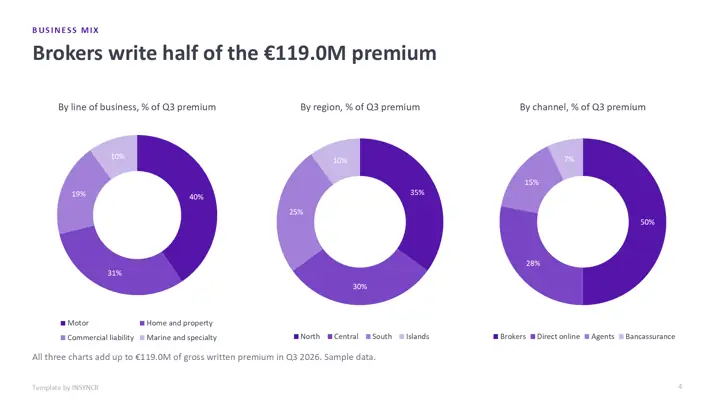
| 4 | Business mix | Premium by line, region and channel, three doughnuts that add up to the same total |
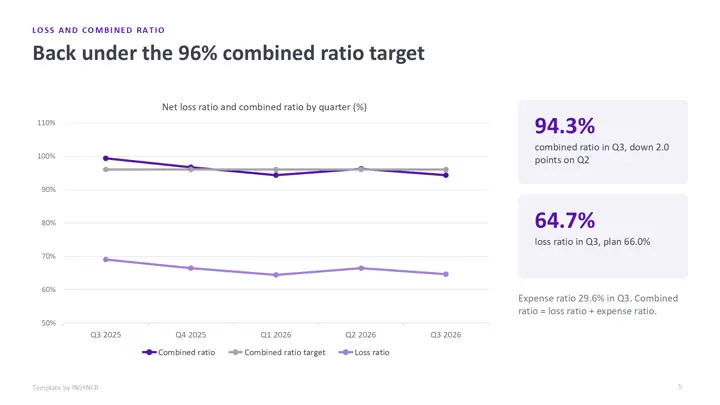
| 5 | Loss and combined ratio | Both ratios by quarter against the combined ratio target |
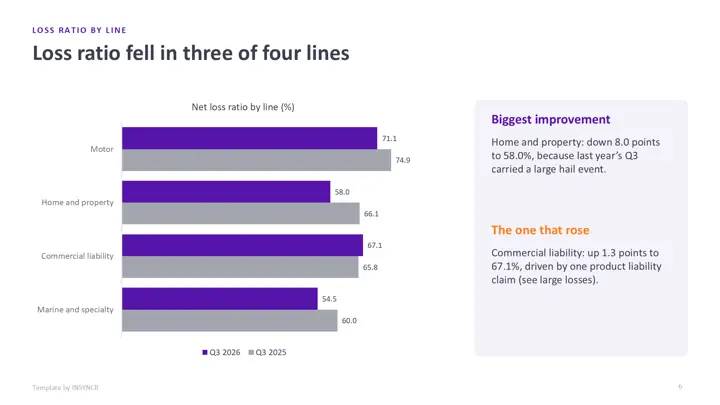
| 6 | Loss ratio by line | Each line this quarter against the same quarter last year |
| 7 | Claims frequency and severity | Claims per 1,000 policies and average cost per claim on one combo chart |
| 8 | Large and catastrophe losses | Each large loss with gross, reinsurance and net cost |
| 9 | Rate change | Renewal rate change by line against plan, weighted for the whole portfolio |
| 10 | Reserve development | Waterfall from opening to closing reserves: payments, prior year release, case reserves and IBNR |
| 11 | Exposure accumulation | Sums insured, modelled 1 in 200 year loss and appetite limit used by region |
| 12 | Outlook and actions | Three outlook points and an owned, dated action table |
| 13 | Keeping it current | How to refresh it by hand or automatically |
Lamna Insurance is fictional and so is every figure. The ratios are computed from the components: loss ratio is net incurred losses divided by net earned premium, and combined ratio is the loss ratio plus the expense ratio. The modelled catastrophe losses are placeholders for your own model run.
How do you use the template by hand?
- Download the file in the colour theme you like and open it in PowerPoint.
- Fill in the headline table from the finance ledger and the claims system at quarter end.
- Update each chart: right click it, choose Edit Data, and paste your figures into the sheet that opens. Start with premium by line and the ratio trend.
- Update the large losses, rate change, reserve and exposure tables, then the reserve waterfall (its notes explain the hidden base series).
- Reread every slide title against the new numbers, rewrite the outlook, delete the sample labels and save it as next quarter's starting point.
The first quarter takes an afternoon. The catch is that steps 2 to 4 come back every quarter, and often every month for the lines that need closer watching.
How do you wire it to live data with INSYNCR?
Insurance figures usually live in a data warehouse, not a spreadsheet. If yours sit in SQL Server or in an Excel workbook, you can link the review to them once and refresh it after each close instead of retyping.
- Install INSYNCR. It appears as a tab in the PowerPoint ribbon.
- Select a chart, table or number on a slide and link it to the matching cells in Excel, or to a custom SQL query that returns exactly the rows it needs.
- After quarter end close, refresh. The ratios, charts and tables update in place, and you only rewrite the titles and the outlook.
The template's charts and tables are native PowerPoint objects, so links attach without rebuilding any slide. INSYNCR runs in PowerPoint on Windows (Office 2016 and later), not on a Mac or in the browser. Excel works on every plan; SQL Server needs the Professional plan.
Start a free 7 day trial No credit card.
Questions about this template
What should an insurance portfolio review include?
Most reviews carry premium by line, the loss ratio and combined ratio against plan and prior year, claims frequency and severity, large and catastrophe losses, rate change on renewals, reserve development and exposure against appetite, then an outlook with actions. This template has a slide for each.
How are loss ratio and combined ratio calculated in the template?
Loss ratio is net incurred losses divided by net earned premium. Expense ratio is expenses divided by net earned premium. Combined ratio is the two added together, and below 100% means an underwriting profit. The template computes all three from the same figures, so they always agree.
Is the insurance portfolio review template really free?
Yes. There's no form, no sign up and no watermark beyond a small "Template by INSYNCR" line in the footer, which you can delete. You can use it inside your own company.
Does the template work in Google Slides or Keynote?
It opens in both, but the native charts may turn into static pictures, so editing the numbers is easiest in PowerPoint. Live data linking with INSYNCR needs PowerPoint on Windows.