 Skip to content



What's inside the monthly management report template?
Fourteen 16:9 slides. Every chart and table is a native PowerPoint object you can edit, and every slide has speaker notes.
| # | Slide | What it shows |
|---|---|---|
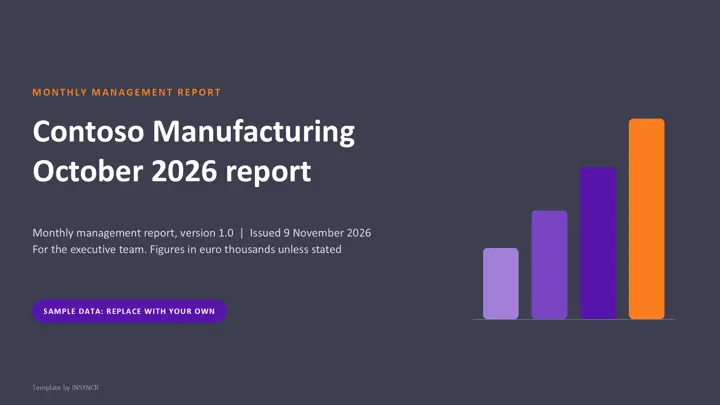
| 1 | Cover | Company, month, version and issue date |
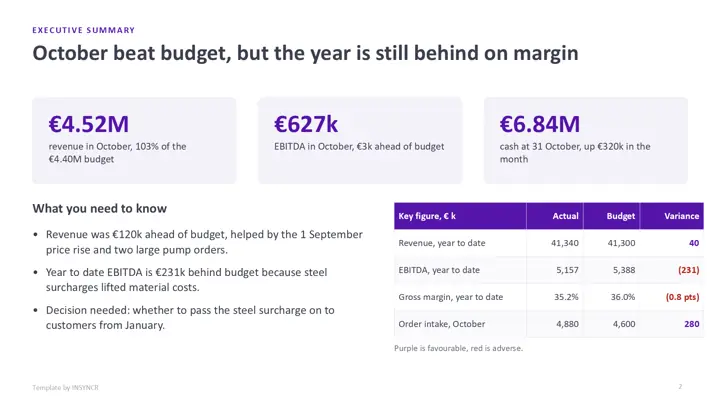
| 2 | Executive summary | Revenue, EBITDA and cash tiles, four key figures against budget, three bullets |
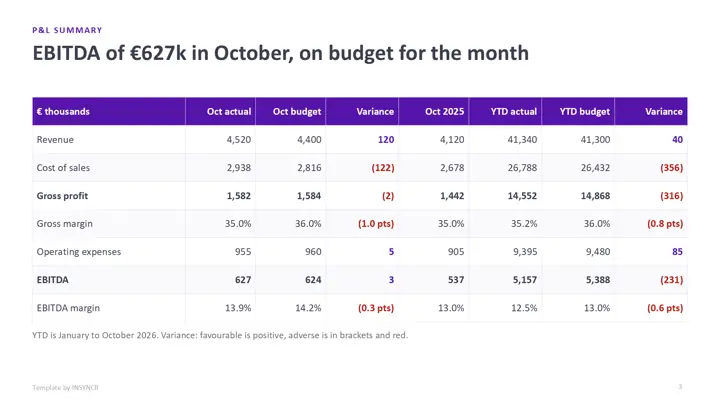
| 3 | P&L summary | Month and year to date against budget and last year, variances coloured |
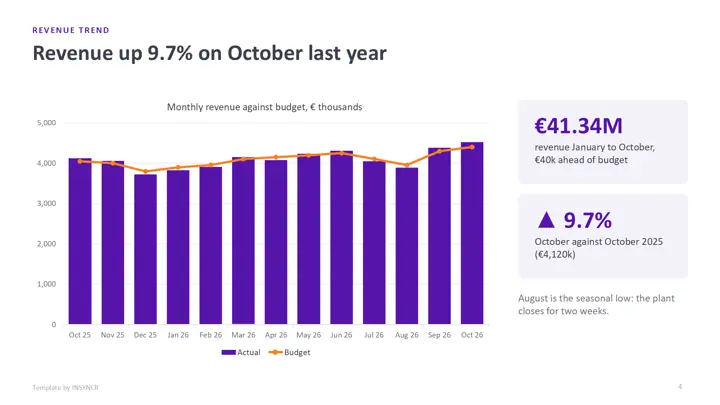
| 4 | Revenue trend | Thirteen months of revenue as columns against a budget line |
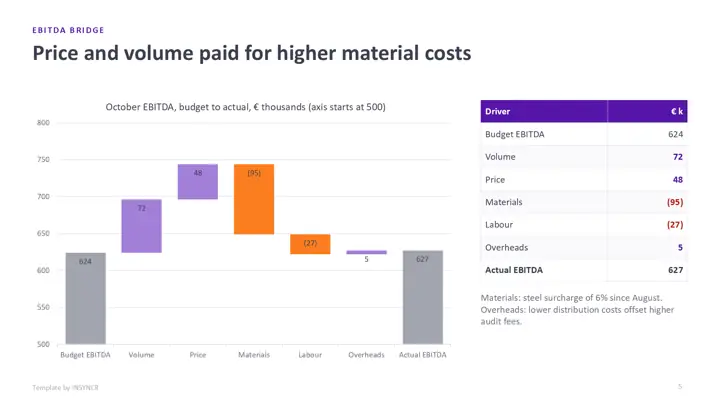
| 5 | EBITDA bridge | Waterfall from budget to actual EBITDA by driver, with the driver table |
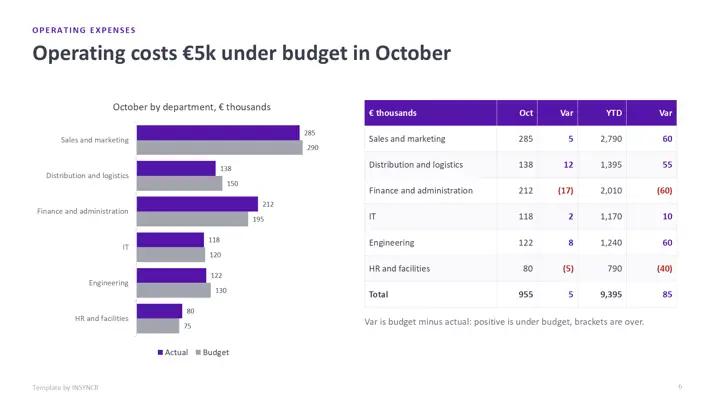
| 6 | Operating expenses | Departments against budget for the month and the year to date |
| 7 | Balance sheet highlights | Working capital, cash, borrowings and net debt, with debtor and inventory days |
| 8 | Cash and liquidity | Month end cash and a 13 week cash forecast against the bank minimum |
| 9 | KPI dashboard | Ten operating KPIs with target and status |
| 10 | Segment performance | Revenue by business unit as stacked columns, with share and margin |
| 11 | Variance commentary | Why, what it means and the action for each material variance |
| 12 | Forecast and outlook | Full year forecast against budget, plus risks and opportunities |
| 13 | Actions and decisions | Owner, date and status for each item |
| 14 | Keeping it current | How to refresh it by hand or automatically |
The sample company is Contoso Manufacturing and every figure is made up, but the numbers hold together: the departments add up to the P&L, the bridge lands on actual EBITDA, the segments add up to revenue and the forecast quarters match the trend chart.
How do you use the template by hand?
- Download the file in the colour you like and open it in PowerPoint.
- Export the month end P&L, balance sheet and department costs from your finance system and type them into the P&L, operating expenses and balance sheet tables.
- Update each chart: right click it, choose Edit Data, and paste your figures. For the EBITDA bridge, change the Up and Down values and set each Offset to the running total (the speaker notes explain it).
- Recolor any variance that changed sign: purple when favourable, red when adverse.
- Rewrite the commentary and every slide title so it states this month's conclusion, then delete the sample labels.
The first month takes most of a day. The catch is that steps 2 to 4 come back after every close, and a variance left in the wrong colour is the kind of slip a director spots first.
How do you wire it to live data with INSYNCR?
If your month end figures already sit in an Excel workbook or a SQL Server table, you can link the pack to them once and refresh it after each close instead of retyping. INSYNCR does this from inside PowerPoint.
- Install INSYNCR. It appears as a tab in the PowerPoint ribbon.
- Select a chart, table or number on a slide and link it to the matching cells in Excel or the matching query in SQL Server.
- After each month end close, refresh. The tables, charts and headline numbers update in place, and you only rewrite the commentary.
The template's charts and tables are native PowerPoint objects, so links attach without rebuilding any slide. INSYNCR runs in PowerPoint on Windows (Office 2016 and later), not on a Mac or in the browser. Excel works on every plan; SQL Server needs the Professional plan.
Start a free 7 day trial No credit card.
Questions about this template
What should a monthly management report include?
Most packs carry an executive summary, the P&L against budget and last year, an EBITDA or profit bridge, costs by department, balance sheet highlights, cash and a short term cash forecast, operating KPIs, commentary on the big variances, the full year outlook and the actions agreed. This template has a slide for each.
How do I build an EBITDA bridge in PowerPoint?
The template uses a stacked column chart with an invisible offset series underneath the visible up and down bars, which works in every version of PowerPoint. Right click the chart, choose Edit Data, change the driver values and set each offset to the running total. The speaker notes on slide 5 walk through it.
Is the monthly management report template really free?
Yes. There's no form, no sign up and no watermark beyond a small "Template by INSYNCR" line in the footer, which you can delete. You can use it for your own company or your clients.
Does the template work in Google Slides or Keynote?
It opens in both, but the native charts may turn into static pictures, so editing the numbers is easiest in PowerPoint. Live data linking with INSYNCR needs PowerPoint on Windows.