 Skip to content





What's inside the ESG and impact report template?
Fourteen 16:9 slides. Every chart and table is a native PowerPoint object you can edit, and every slide has speaker notes that explain what goes there and where the data usually comes from.
| # | Slide | What it shows |
|---|---|---|
| 1 | Cover | Organisation, reporting year and frameworks |
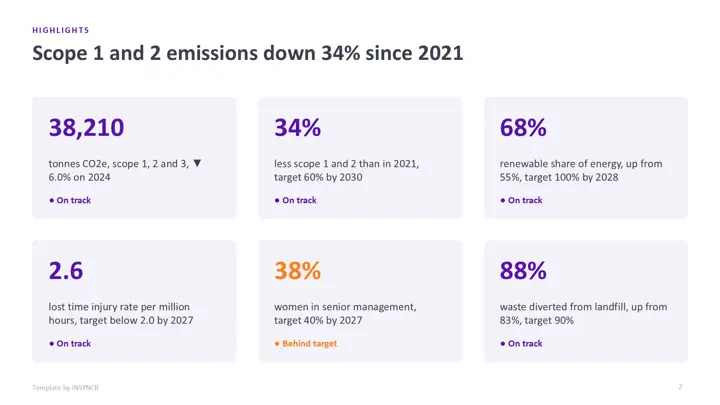
| 2 | Highlights | Six headline metrics with a status against target |
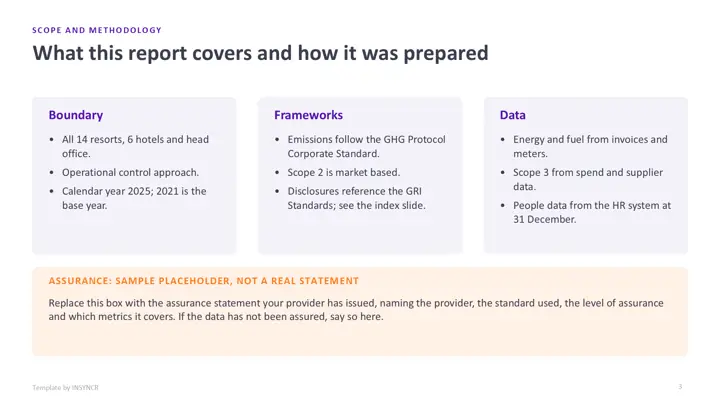
| 3 | Scope and methodology | Boundary, frameworks, data sources and an assurance placeholder |
| 4 | Greenhouse gas emissions | Scope 1, 2 and 3 for five years, with totals |
| 5 | Emissions intensity | Emissions per million of revenue against a straight line path to the 2030 target |
| 6 | Energy | Energy use and renewable share on one combo chart |
| 7 | Water and waste | Water withdrawn and consumed, waste by route and the diversion rate |
| 8 | Our people | Headcount, women by level and the gender pay gap |
| 9 | Health and safety | Lost time and recordable injury rates over five years |
| 10 | Community impact | People reached, cost and outcome per programme |
| 11 | Governance | Board composition, policies and training completion |
| 12 | Targets and progress | Every target with baseline, current value and status |
| 13 | GRI content index | A placeholder index to check against the current standards |
| 14 | Keeping it current | How to refresh it by hand or automatically |
Alpine Ski House Group is fictional and so is every figure. The GHG Protocol and the GRI Standards are named as frameworks, but the GRI index is a placeholder: check every row against the version of the standards in force and your own material topics. The assurance box is a sample placeholder, not a real statement.
How do you use the template by hand?
- Download the file in the colour theme you like and open it in PowerPoint.
- Collect the year's data from facilities, HR, finance and programme partners into one Excel workbook.
- Update each chart: right click it, choose Edit Data, and add the new year. Start with emissions by scope.
- Update the tables, then the highlights and the targets slide, so every status matches the numbers.
- Replace the methodology, assurance and GRI index placeholders with your own wording, delete the sample labels and save it as next year's starting point.
The first year takes a few days, mostly collecting data. The catch is that funds and larger companies now report some of these metrics every quarter, so steps 2 to 4 keep coming back.
How do you wire it to live data with INSYNCR?
If your sustainability metrics sit in an Excel workbook or a SQL Server table, you can link the report to them once and refresh it when the data is final, so the highlights, charts and targets can never disagree.
- Install INSYNCR. It appears as a tab in the PowerPoint ribbon.
- Select a chart, table or number on a slide and link it to the matching cells in Excel or the matching query in SQL Server.
- When the year's or quarter's data is final, refresh. The slides update in place, and you only rewrite the commentary.
The template's charts and tables are native PowerPoint objects, so links attach without rebuilding any slide. INSYNCR runs in PowerPoint on Windows (Office 2016 and later), not on a Mac or in the browser. Excel works on every plan; SQL Server needs the Professional plan.
Start a free 7 day trial No credit card.
Questions about this template
What should an ESG and impact report include?
Most reports cover the boundary and method, greenhouse gas emissions by scope and their intensity, energy, water and waste, the workforce and diversity, health and safety, community impact, governance, progress against targets and an index to the framework used. This template has a slide for each.
How is emissions intensity calculated?
Emissions intensity is total emissions in tonnes of CO2 equivalent divided by a measure of activity, here revenue in millions of euros. It shows whether emissions fall as the business grows. Some sectors use floor area, production volume or headcount instead; pick one and keep it.
Can I use the GRI index and the assurance statement as they are?
No. The GRI index lists topic standards that commonly match the slides, but the disclosure numbers and requirements depend on the version in force and on your material topics, so it's marked as a placeholder to check. The assurance box is a sample; only your assurance provider can supply the real statement.
Is the ESG and impact report template really free?
Yes. There's no form, no sign up and no watermark beyond a small "Template by INSYNCR" line in the footer, which you can delete. It opens in Google Slides and Keynote too, though the charts may turn into pictures there.