 Skip to content



What's inside the QBR template?
Thirteen 16:9 slides. Every chart and table is a native PowerPoint object you can edit, and every slide has speaker notes that explain what goes there.
| # | Slide | What it shows |
|---|---|---|
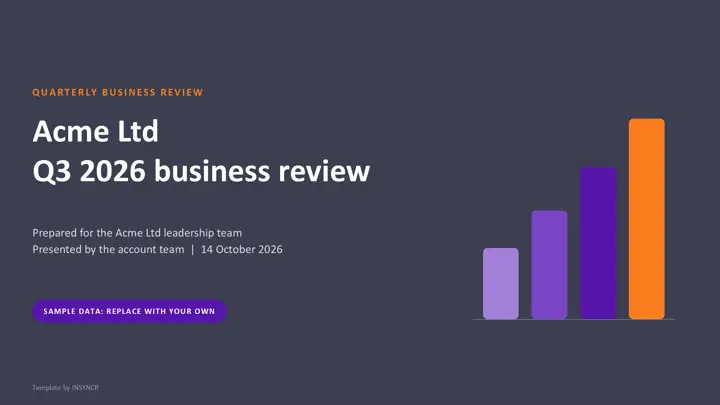
| 1 | Title | Customer or team, quarter, audience, date |
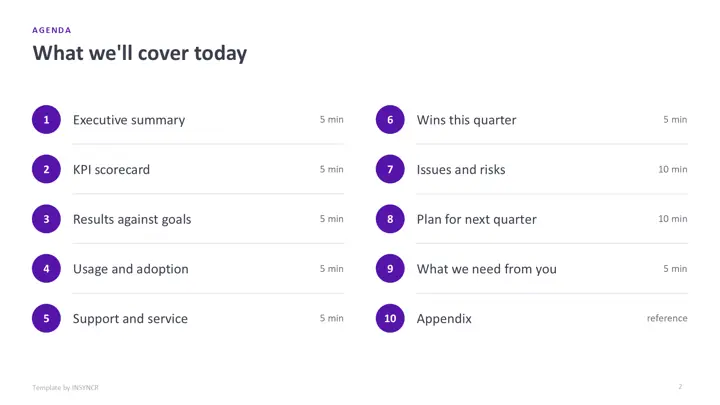
| 2 | Agenda | Ten sections with a time for each |
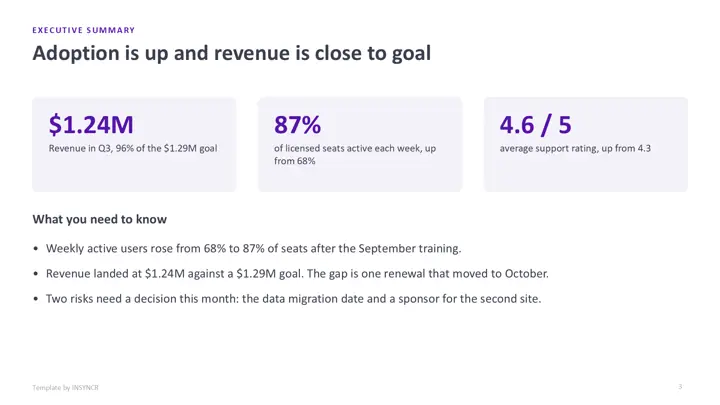
| 3 | Executive summary | Three headline numbers and three lines on what matters |
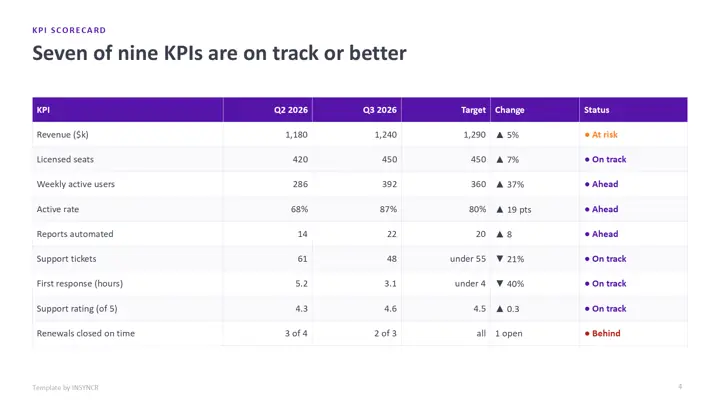
| 4 | KPI scorecard | Table of nine KPIs: last quarter, this quarter, target, change, status |
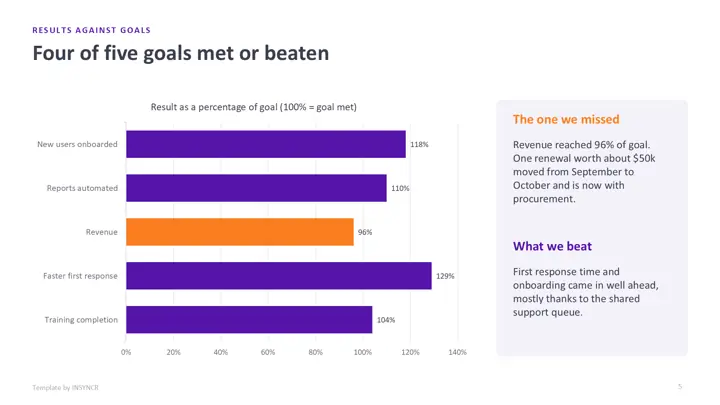
| 5 | Results against goals | Bar chart of each goal as a percentage of target |
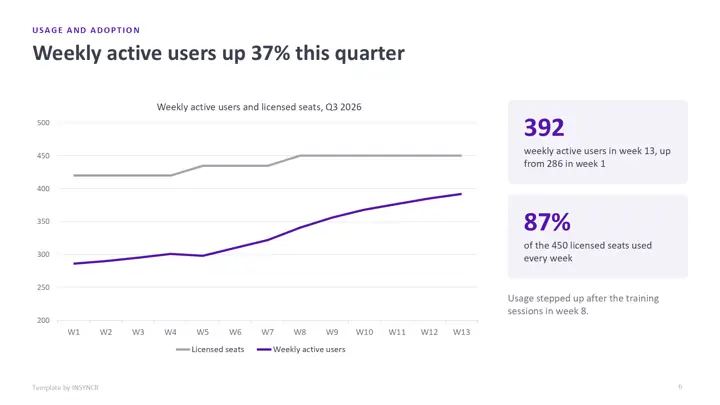
| 6 | Usage and adoption | Line chart of weekly active users against licensed seats |
| 7 | Support and service | Doughnut chart of tickets by type, plus four service numbers |
| 8 | Wins this quarter | Three wins, each with a number and who made it happen |
| 9 | Issues and risks | Table with impact, likelihood, owner and next step |
| 10 | Plan for next quarter | Timeline with three milestones per month |
| 11 | What we need from you | Three specific asks |
| 12 | Appendix | Monthly data table behind the charts |
| 13 | Keeping the deck current | How to refresh it by hand or automatically |
The sample company is Acme Ltd, and all figures are made up. A purple label on the cover reminds you to replace them.
How do you use the template by hand?
- Download the file and open it in PowerPoint.
- Fill in the appendix table on slide 12 first. It's the one place every other number comes from.
- Update each chart: right click it, choose Edit Data, and paste your figures into the sheet that opens.
- Update the KPI scorecard, the headline numbers and the issues table, then rewrite each slide title so it states your conclusion ("Revenue is close to goal"), not just the topic.
- Read the speaker notes, delete the sample data label on the cover and any section you don't need, and save it as your master copy for next quarter.
That's about an hour the first time. The catch is that you'll do steps 2 to 4 again every quarter.
How do you wire it to live data with INSYNCR?
If your numbers already live in an Excel workbook or a SQL Server table, you can link the deck to them once and refresh it before each review instead of retyping. INSYNCR does this from inside PowerPoint.
- Install INSYNCR. It appears as a tab in the PowerPoint ribbon.
- Select a chart, table or number on a slide and link it to the matching cells in Excel or the matching query in SQL Server.
- Before each QBR, refresh. The charts, tables and numbers update in place, and you only rewrite the titles and the story.
The template's charts and tables are native PowerPoint objects, so links attach without rebuilding any slide. INSYNCR runs in PowerPoint on Windows (Office 2016 and later), not on a Mac or in the browser. Excel works on every plan; SQL Server needs the Professional plan.
Start a free 7 day trial No credit card.
Questions about this template
What should a quarterly business review include?
Most QBRs cover the same ground: a short summary, results against the goals you agreed last time, usage or adoption, wins, problems and risks, the plan for next quarter, and what you need from the other side. This template has a slide for each, in that order.
How long should a QBR presentation be?
Aim for 10 to 15 slides and 45 to 60 minutes. Spend most of the time on issues, the plan and the asks, because that's where decisions get made. Put detailed data in the appendix rather than on the main slides.
Is the QBR template really free?
Yes. There's no form, no sign up and no watermark beyond a small "Template by INSYNCR" line in the footer, which you can delete. You can use it for your own clients and teams.
Does the template work in Google Slides or Keynote?
It opens in both, but the native charts may turn into static pictures, so editing the numbers is easiest in PowerPoint. Live data linking with INSYNCR needs PowerPoint on Windows.