 Skip to content



What's inside the statistics release template?
Twelve 16:9 slides. Every chart and table is a native PowerPoint object you can edit, and every slide has speaker notes that explain what goes there.
| # | Slide | What it shows |
|---|---|---|
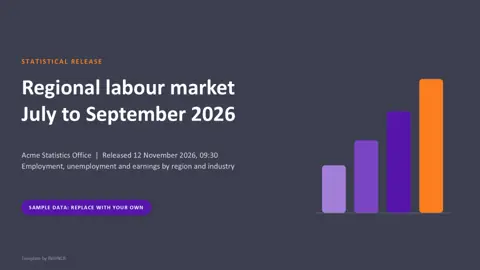
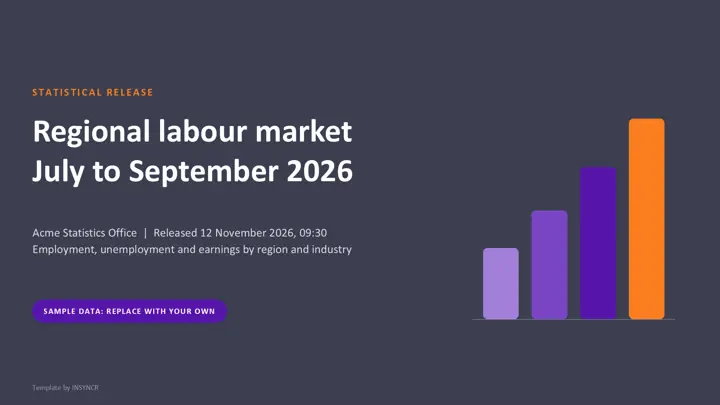
| 1 | Cover | Release name, period covered, publisher, release date and time |
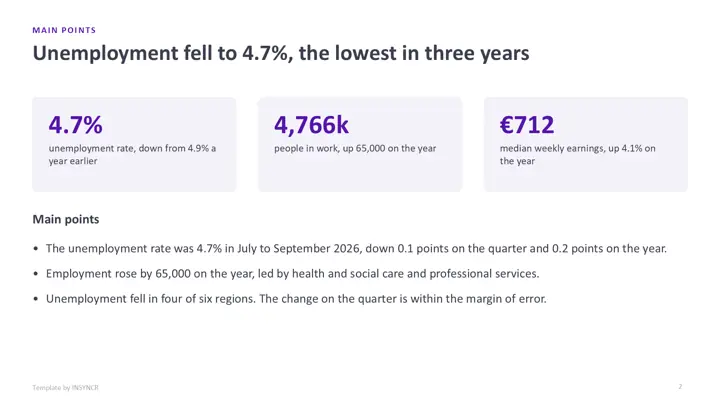
| 2 | Main points | Three headline numbers and three plain sentences |
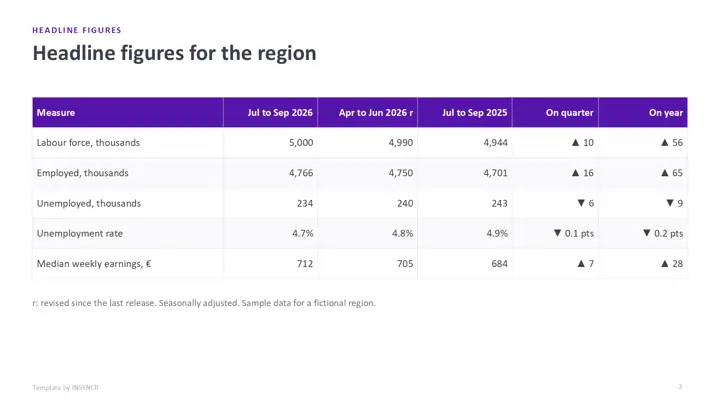
| 3 | Headline figures | Latest quarter, previous quarter and a year ago, with changes |
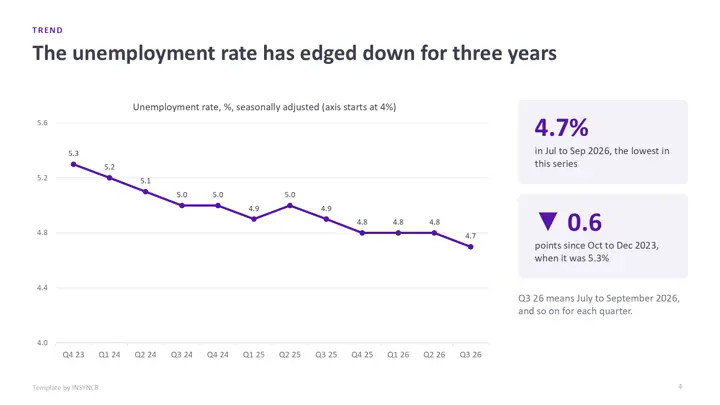
| 4 | Trend | Line chart of the headline measure over three years |
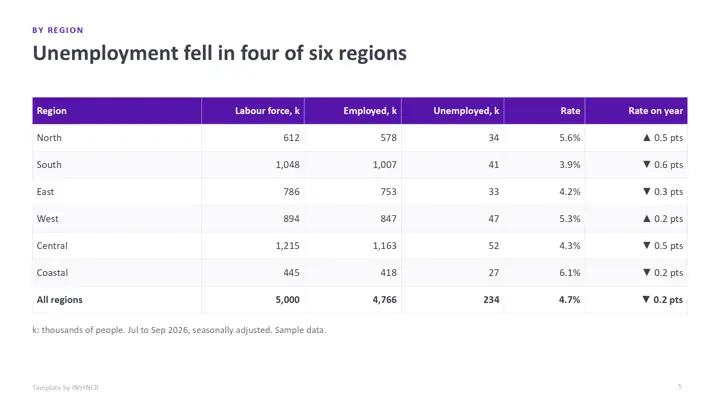
| 5 | By region | Table of labour force, employed, unemployed and rate for each region, with a total |
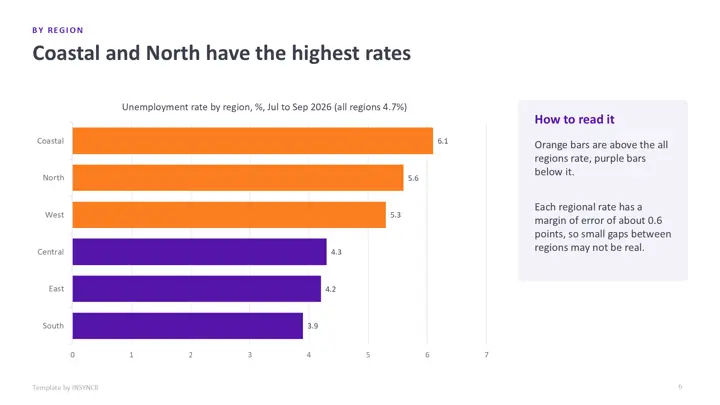
| 6 | By region chart | Sorted bar chart of the regional rates against the overall rate |
| 7 | By industry | Employment by industry this year and last, adding up to the total |
| 8 | Earnings | Column chart of median weekly earnings over five quarters |
| 9 | Methodology | Source, definitions, reliability and adjustment in plain words |
| 10 | Revisions | Old and new values for every revised figure, with the reason and the policy |
| 11 | Contact and next release | Team, data tables and the next release date |
| 12 | Keeping it current | How to refresh it by hand or automatically |
The sample publisher is the Acme Statistics Office and the topic is a regional labour market. Every figure is made up, and the contact details are placeholders.
How do you use the template by hand?
- Download the file and open it in PowerPoint.
- Fill in the headline table first, then the region and industry tables from your new data tables. Check that each breakdown adds up to its total.
- Update each chart: right click it, choose Edit Data, and paste your figures. The last point of the trend chart must equal the headline figure.
- Record every changed figure on the revisions slide, and update the methodology if anything about the source changed.
- Rewrite the main points and every slide title, replace the contact details, delete the sample labels and save it as next quarter's starting point.
That's a few hours the first time. The catch is that steps 2 to 4 come back every release, under a fixed publication time.
How do you wire it to live data with INSYNCR?
If your release tables already live in an Excel workbook or a SQL Server table, you can link the slides to them once and refresh on release day instead of retyping. INSYNCR does this from inside PowerPoint.
- Install INSYNCR. It appears as a tab in the PowerPoint ribbon.
- Select a chart, table or number on a slide and link it to the matching cells in Excel or the matching query in SQL Server.
- On release day, refresh. The charts, tables and numbers update in place, and you only write the main points.
The template's charts and tables are native PowerPoint objects, so links attach without rebuilding any slide. INSYNCR runs in PowerPoint on Windows (Office 2016 and later), not on a Mac or in the browser. Excel works on every plan; SQL Server needs the Professional plan.
Start a free 7 day trial No credit card.
Questions about this template
What should a statistical release include?
Main points first, then the headline figures with their changes, a trend chart, breakdowns by area and category, methodology notes, revisions since the last release and a contact. This template follows that order, which is the common pattern for official statistics.
Why does the template show revisions so openly?
Revisions are normal: late returns and updated sources change recent figures. Showing the old and new value with the reason lets readers trust the series, and many statistics codes of practice expect it.
Is the statistics release template really free?
Yes. There's no form, no sign up and no watermark beyond a small "Template by INSYNCR" line in the footer, which you can delete. You can use it for your own releases.
Does the template work in Google Slides or Keynote?
It opens in both, but the native charts may turn into static pictures, so editing the numbers is easiest in PowerPoint. Live data linking with INSYNCR needs PowerPoint on Windows.