 Skip to content



What's inside the client performance report template?
Thirteen 16:9 slides. Every chart and table is a native PowerPoint object you can edit, and every slide has speaker notes that explain what goes there and where the numbers usually come from.
| # | Slide | What it shows |
|---|---|---|
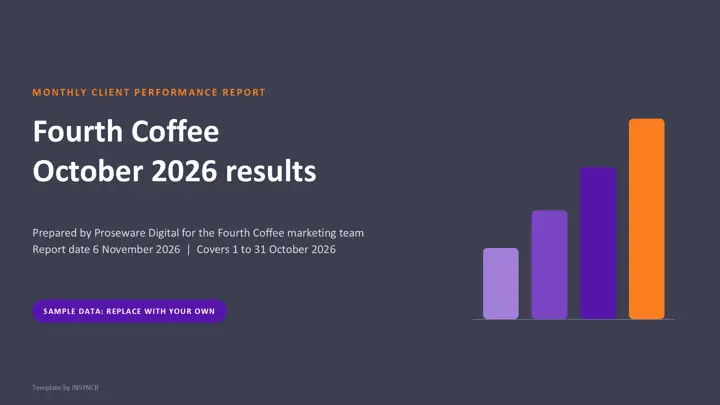
| 1 | Cover | Client, month and agency |
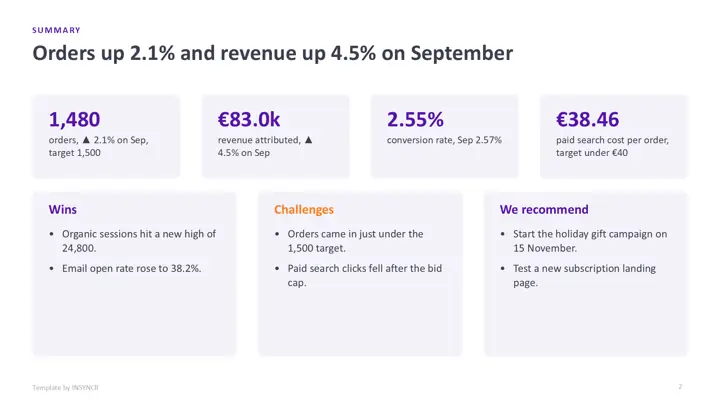
| 2 | Summary | Four KPI tiles against last month and target, plus wins, challenges and recommendations |
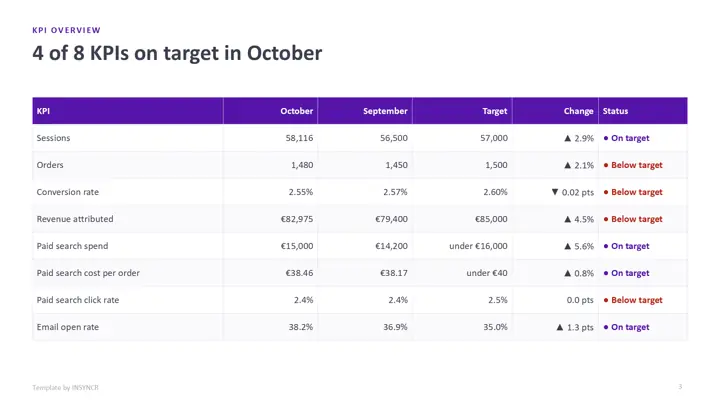
| 3 | KPI overview | Every agreed KPI with this month, last month, target, change and status |
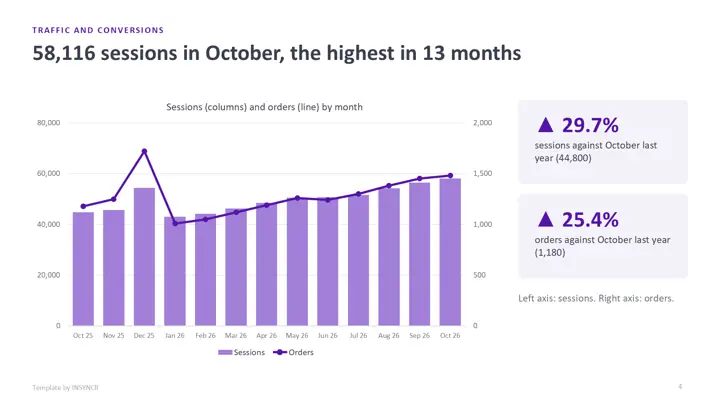
| 4 | Traffic and conversions | Sessions and orders over 13 months on one combo chart |
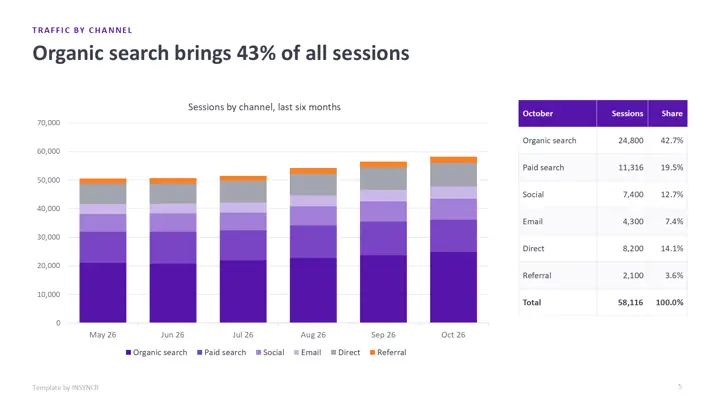
| 5 | Traffic by channel | Sessions by channel for six months, with October shares |
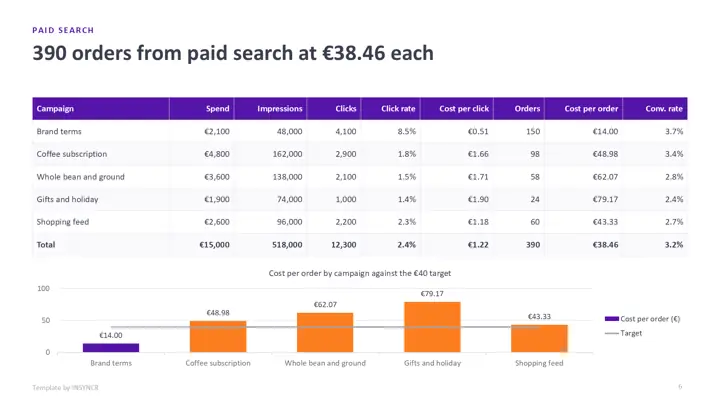
| 6 | Paid search | Spend, impressions, clicks, click rate, cost per click, orders and cost per order by campaign |
| 7 | Search engine optimisation | Keywords by ranking position and the top queries |
| 8 | Social media | Reach, engagements, engagement rate and followers by platform |
| 9 | Sends, open rate and click rate over six months | |
| 10 | Orders and revenue attributed | Orders, average order value, revenue and return on ad spend by channel |
| 11 | Goals and budget | Spend against budget by line and progress toward the quarter's goal |
| 12 | Next month | Three planned items and what the agency needs from the client |
| 13 | Keeping it current | How to refresh it by hand or automatically |
Proseware Digital and Fourth Coffee are fictional and so is every figure. Social platform names are generic placeholders, so you can put in the networks your client actually uses. This is a marketing agency report; for a wealth manager's client meeting, see the client review pack template.
How do you use the template by hand?
- Download the file in the colour theme you like and open it in PowerPoint.
- Export the month's numbers from analytics, the ad platforms, social, email and the shop into one Excel workbook.
- Update each chart: right click it, choose Edit Data, and paste the new month. Start with traffic and conversions.
- Update the KPI, campaign, query, revenue and budget tables from the same workbook.
- Rewrite the summary and next month's plan, delete the sample labels and save a copy for the client.
The first client takes a morning. The catch is that it's one report per client per month, so an agency with 20 clients repeats steps 2 to 5 twenty times.
How do you wire it to live data with INSYNCR?
If each client's figures land in an Excel workbook, or in a SQL Server table with a client column, you can link the master deck to them once and produce every client's report from it each month.
- Install INSYNCR. It appears as a tab in the PowerPoint ribbon.
- Select a chart, table or number on a slide and link it to the matching cells in Excel or the matching query in SQL Server.
- Each month, refresh and save one file per client, much like a mail merge. You only rewrite the summary and the plan.
The template's charts and tables are native PowerPoint objects, so links attach without rebuilding any slide. INSYNCR runs in PowerPoint on Windows (Office 2016 and later), not on a Mac or in the browser. Excel works on every plan; SQL Server needs the Professional plan.
Start a free 7 day trial No credit card.
Questions about this template
What should a monthly client performance report include?
Most agency reports open with a summary and a KPI table against target, then cover traffic and conversions, each channel the agency runs (paid search, SEO, social, email), revenue attributed and budget against spend, and close with next month's plan and requests. This template has a slide for each.
How are CTR, CPC, CPA and conversion rate calculated?
Click rate (CTR) is clicks divided by impressions. Cost per click (CPC) is spend divided by clicks. Cost per acquisition (CPA), here cost per order, is spend divided by orders. Conversion rate is orders divided by clicks for a campaign, or orders divided by sessions for the whole site. The template computes each one from the raw columns.
Is the client performance report template really free?
Yes. There's no form, no sign up and no watermark beyond a small "Template by INSYNCR" line in the footer, which you can delete. You can use it for your own clients.
Does the template work in Google Slides or Keynote?
It opens in both, but the native charts may turn into static pictures, so editing the numbers is easiest in PowerPoint. Live data linking with INSYNCR needs PowerPoint on Windows.