 Skip to content





What's inside the fund performance report template?
Fourteen 16:9 slides. Every chart and table is a native PowerPoint object you can edit, and every slide has speaker notes that explain what goes there and where the numbers usually come from.
| # | Slide | What it shows |
|---|---|---|
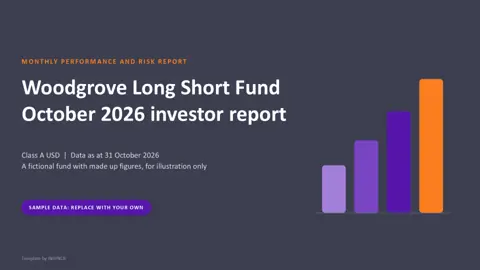
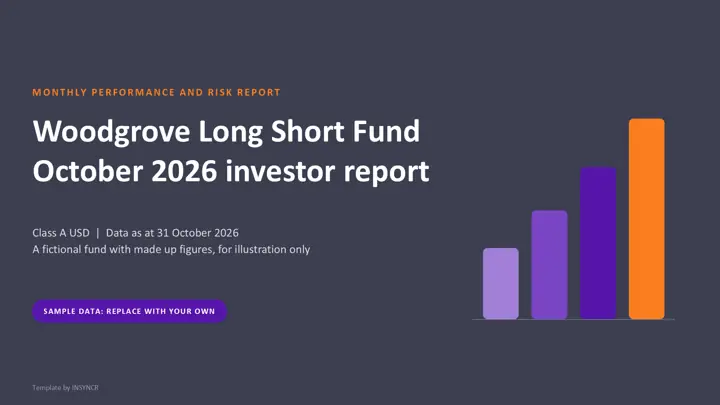
| 1 | Cover | Fund, share class and the date the data is taken from |
| 2 | Summary | Month and year to date return, NAV per share, fund size, returns against the benchmark, exposure |
| 3 | Monthly returns | Every monthly net return since launch with the calendar year totals |
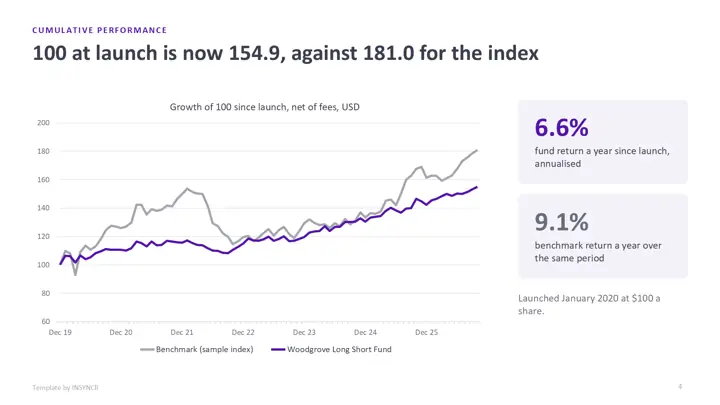
| 4 | Cumulative performance | Growth of 100 for the fund and the benchmark |
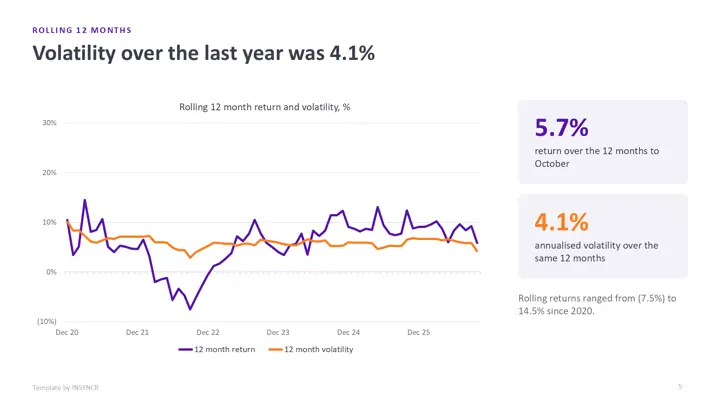
| 5 | Rolling 12 months | Trailing 12 month return and volatility |
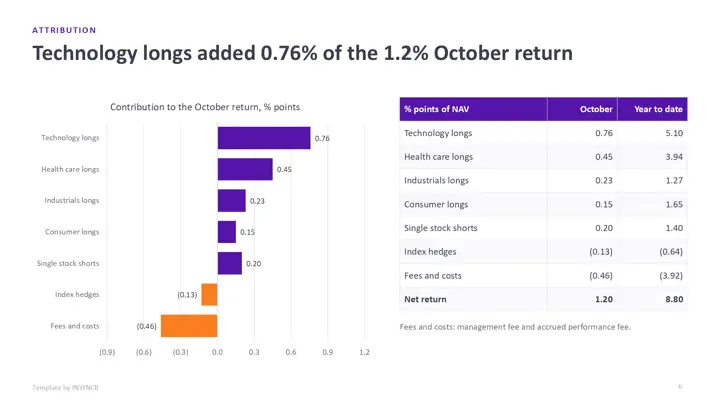
| 6 | Attribution | Contribution by book for the month and the year to date, adding up to the net return |
| 7 | Exposure | Long, short, gross and net exposure over the last 12 months |
| 8 | Exposure by sector and region | Long and short books at month end |
| 9 | Risk statistics | Volatility, Sharpe, Sortino, maximum drawdown, beta, correlation, VaR, each explained |
| 10 | Drawdown | Distance below the previous high, fund against benchmark |
| 11 | Contributors and detractors | The five best and five worst positions, footing to the net return |
| 12 | Liquidity | How much of the portfolio can be sold in 1 day up to 60 days, plus dealing terms |
| 13 | Commentary and disclosures | Manager commentary, fund terms and a disclaimer placeholder |
| 14 | Keeping it current | How to refresh it by hand or automatically |
The sample fund is the Woodgrove Long Short Fund, its positions are fictional companies and the benchmark is unnamed on purpose. Every figure is made up, and the disclaimer is a placeholder for your compliance team's wording, not real regulatory text. If you also publish a one page factsheet, our fund factsheet template is the companion piece.
How do you use the template by hand?
- Download the file in the colour theme you like and open it in PowerPoint.
- Add the month's net return to the returns grid and update the summary slide from your administrator's NAV.
- Extend each chart: right click it, choose Edit Data, and add the new month to the sheet that opens.
- Paste in the attribution, exposure and contributor figures from your risk system or prime broker, and recalculate the risk statistics.
- Rewrite the commentary, check the disclaimer, delete the sample labels and save it as next month's starting point.
The first month takes most of a day. The catch is that steps 2 to 4 come back every month, and the risk statistics and the grid have to agree with each other to the decimal.
How do you wire it to live data with INSYNCR?
If your returns and exposures already live in a SQL Server database or an Excel workbook, you can link the report to them once and refresh it each month instead of retyping. INSYNCR does this from inside PowerPoint.
- Install INSYNCR. It appears as a tab in the PowerPoint ribbon.
- Select a chart, table or number on a slide and link it to the matching query in SQL Server or the matching cells in Excel.
- At month end, refresh. The grid, the charts and the tables update in place, and you only rewrite the commentary.
The template's charts and tables are native PowerPoint objects, so links attach without rebuilding any slide. INSYNCR runs in PowerPoint on Windows (Office 2016 and later), not on a Mac or in the browser. Excel works on every plan; SQL Server needs the Professional plan.
Start a free 7 day trial No credit card.
Questions about this template
What goes in a monthly hedge fund report?
Most monthly reports carry the net return for the month and year to date, a returns grid since launch, performance against a benchmark, attribution, gross and net exposure, risk statistics such as volatility, Sharpe ratio and maximum drawdown, a liquidity profile, the manager's commentary and the fund terms and disclosures.
How is this different from a fund factsheet?
A factsheet is a short public summary, usually two pages. This report goes deeper for existing investors and their consultants: exposure, attribution, drawdown, liquidity and the full returns grid.
Can I use the disclaimer in the template?
No. It's a placeholder that says the figures are sample data and not advice. The wording on a real investor report depends on your firm, your fund and your market, so your compliance or legal team has to supply it.
Is the fund performance report template really free?
Yes. There's no form, no sign up and no watermark beyond a small "Template by INSYNCR" line in the footer, which you can delete. You can use it for your own funds.